Physical Development Status
Road, Transport, Electricity and Communication Infrastructure
7.1 Transportation Infrastructure
7.1.1 Status of Road Network
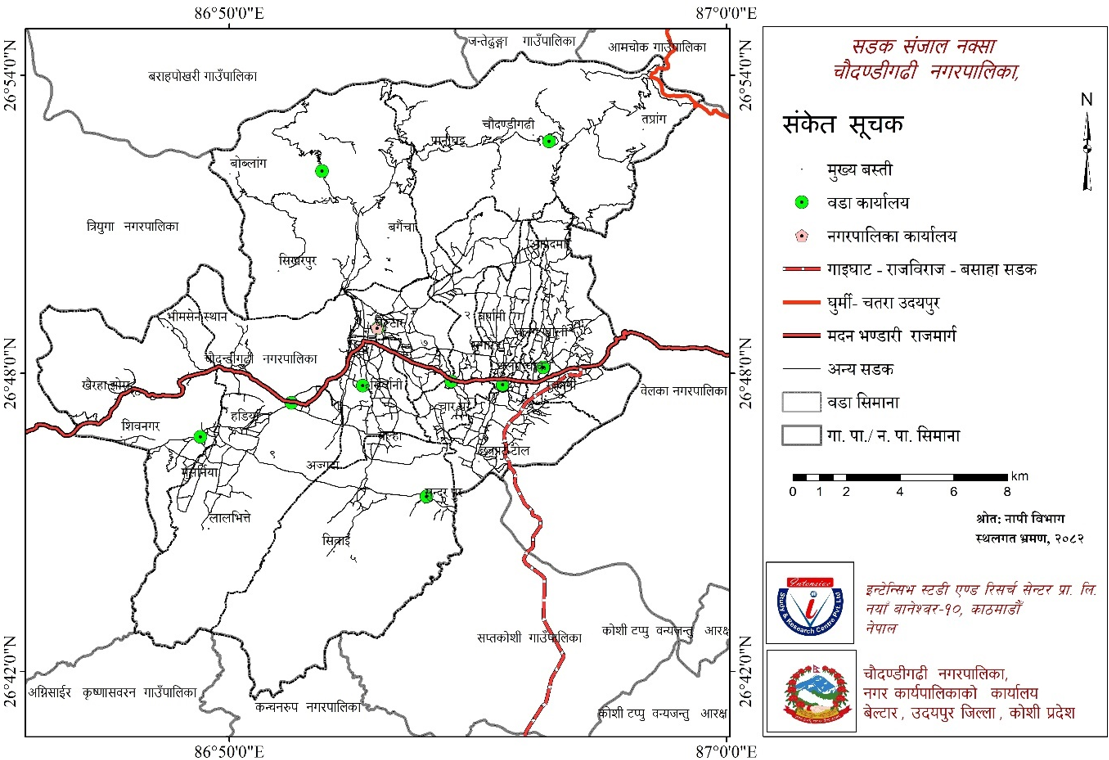
Road network is the primary condition for physical development of any place. With the development of fully facilitated road transport, the door to overall development opens. In the case of local levels, it is necessary to connect ward centers to the municipal center and the municipal center to the national highway system through district roads. By developing and upgrading agricultural roads in settlements, agricultural products can be marketed and the economic condition of the people can be strengthened. Economic revolution is possible by developing industry and tourism sectors through a facilitated road network. In addition, by providing access to religious areas through road networks, domestic and international tourists can be attracted.

By the time the mapping work was done in 2050 BS, the condition of roads in the hilly areas of Nepal was very poor. However, after the political change of 2046 BS, as per the practice of allocating funds to local bodies from the national fund, the work of road expansion in rural areas also started to gain momentum. Since then, rural areas have also made a leap in the expansion of road networks. However, due to remote hilly terrain, mapping of many such physical structures could not be done and due to lack of factual information, exact data on how much road network has been expanded in those areas is not available. In this context, Municipality Transport Master Plan (MTMP) was envisioned to make mandatory provisions based on maps and facts based on transport network data of every village/municipal area. Accordingly, it is necessary to formulate and implement a road transport master plan in this municipality as well.
Looking at the condition of roads in the municipality, it is satisfactory. In the last fiscal year, 3.3 km of blacktopped/paved road was constructed, and by the end of Chaitra of the current fiscal year, 5.5 km of blacktopped/paved road has been constructed. Similarly, 25 km of gravel road was constructed in the last fiscal year and 15 km by the end of Chaitra of the current fiscal year, while 35 km of earthen road was constructed in the last fiscal year and 18 km by the end of Chaitra of the current fiscal year. The details of the municipality's road infrastructure related to the last fiscal year are included in the table below.

Table No. 63: Details regarding Construction of Local Bridges, Drains, Truss Bridges, Culverts, Suspension Bridges, Hume Pipes
| SN | Drain Construction | Bridge/Truss/Culvert | Hume Pipe |
|---|---|---|---|
| 1 | Drain construction north of Siwai Chowk 200m (Ward No. 5) | Iron bridge construction on Taprang River 20m (Ward No. 1) | Hume pipe purchase and transportation 30mm - 15 pcs, 45mm - 7 pcs (Ward No. 4) |
| 2 | Chatara Line drain construction 34m (Ward No. 6) | Kumang bridge and culvert construction 18m (Ward No. 7) | |
| 3 | Drain construction from Siwai Chowk South to Small Farmers Building 190m (Ward No. 5) | Devi River culvert construction 6m length RCC (Ward No. 3) | |
| 4 | Drain construction at Lahure Chowk connecting new trail 160m length (Ward No. 6) | Bhadoli River truss bridge 12m length (Ward No. 9) | |
| 5 | Chaudhary Tole drain construction 52m length (Ward No. 4) | Satbihe truss bridge construction 20m length (Ward No. 10) | |
| 6 | Om Shanti drain construction 75m length (Ward No. 7) | Ghormuna River truss bridge construction 11m length (Ward No. 10) | |
| 7 | Janata Secondary School drain construction 71m length (Ward No. 8) | Lati Khola Charghare culvert construction 7m length (Ward No. 10) | |
| 8 | Drain construction on road from Hadiya Bazar to Beltar 230m length (Ward No. 10) | Bridge construction on Sughare River below Raktamala Devi 6m length (Ward No. 2) | |
| 9 | Hadiya Bazar drain improvement plan 59m length (Ward No. 10) | Paved bridge construction on Karamje River connecting Bhorleni Kusumchauri 12m (Ward No. 3) | |
| 10 | Pachwari Rjamire drain construction 47m length (Ward No. 9) | Culvert construction on Gauri River connecting Simalatar Shikarpur 6m length (Ward No. 8) | |
| 11 | Drain construction near Basnet's house at Khoriya Tole 50m length (Ward No. 9) | Truss bridge construction on Lati River on the way to Devithan 15m length (Ward No. 7) | |
| 12 | Dhami Chap bridge construction 7m length (Ward No. 5) |
Table No. 64: Details of Suspension Bridges and Culverts in the Municipality
| SN | Project Name | Ward No. | Remarks |
|---|---|---|---|
| 1 | Birendra Bazar Susp. Bridge | 8 | |
| 2 | Aamshal Susp. Bridge | 3 | |
| 3 | Sundar Basti Susp. Bridge | 3 | |
| 4 | Chatpate Tole Susp. Bridge | 4 | |
| 5 | Chamere Susp. Bridge | 8 | Bridge connecting Chaudandi 8 and Khotang |
Source:Office of Municipal Executive

7.1.2 Transport Facilities and Routes
To establish mutual contact between people living in different places and geographical areas, it is necessary to develop routes to make public transport easy, effective, accessible and regular. If transport services are operated on different routes, it connects different communities and areas and establishes a sense of unity among the people.
7.1.3 Vehicles Operating within Municipality Area
Recently, under road transport in urban areas and market centers of Nepal, buses, minibuses, Hiace, and microbuses have been found operating for long distances, while microbuses and motorcycles are available for short distances. Among these vehicles, some are private and some are public.
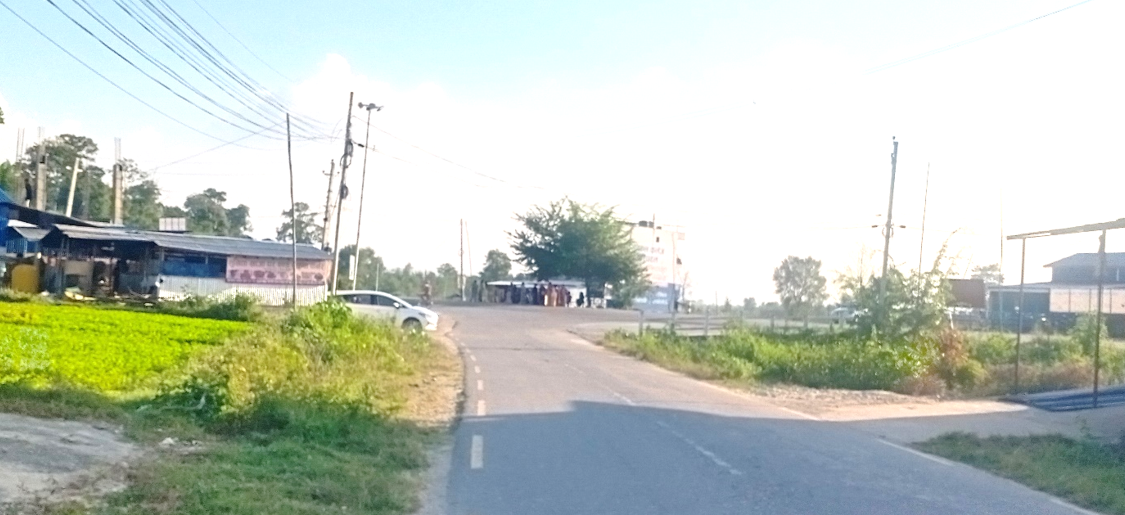
Transport stands as an important infrastructure to make public goods and service delivery simple and easy to mobilize the economic and social development of any region and to develop agricultural and non-agricultural sectors. Mainly trucks, tractors, jeeps, buses, and motorcycles seem to be used in this municipality. It seems necessary to upgrade road routes in all wards of the municipality so that they operate throughout the year. Also, various infrastructures required for road transport such as vehicle parking lots, bus stops, passenger waiting sheds, street lights, road signs, and facilities related to bus terminals need to be developed in an organized manner.
7.1.4 Details regarding Bus Park and Bus Stops
Movement of people can be made easier by constructing bus parks with facilities including electricity, water, passenger waiting sheds, toilets, public mobile charging stations etc. Looking at the practice of developed countries, it is found that proper arrangements for peace and security including help desks are made in bus parks. If facilitated and safe bus parks are constructed, the quality of transport service increases. Structures built in bus parks must be disability friendly. Although Beltar Buspark is in operation in Ward No. 6 of this municipality, it is not in an organized state. Similarly, main market areas of the municipality are serving as bus stops. There is a lack of passenger waiting sheds and toilets here. Details regarding bus parks and bus stops operating in the municipality are presented in the table.
Table No. 65: Details regarding Bus Parks and Bus Stops in the Municipality
| SN | Name | Ward No. | Status | Remarks |
|---|---|---|---|---|
| 1 | Beltar Buspark | 6 | At least 5 long-distance buses and 7 short-distance buses stay at night and currently the bus park is not operating in an organized manner |
Source:Office of Municipal Executive
7.2 Electricity and Alternative Energy
Although electrification has not been done in poor households in some limited remote areas, the number is negligible, so there is no need to make huge investments in electrification. However, plenty of work seems to be needed for the strengthening of the transmission line. In improving the power transmission line, wooden poles need to be replaced by concrete or iron poles first, and transformers need to be installed in places with Low Voltage.
Apart from electricity service, concrete programs seem to be needed for the promotion of alternative and renewable energy. Encouraging and subsidizing biogas construction in livestock farming areas and installing solar energy in both remote and accessible areas can supply regular energy and speed up development activities through energy utilization. Solar energy can be used for operating lift irrigation drinking water projects, domestic consumption and excess energy can be sold to the national transmission line.
Generally, a normal family consumes 2 kilowatts of electricity daily. Even that consumption amount is lower in rural areas. A 17.6 square feet solar panel produces 250 watts of electricity. Throughout the day, from about 6.8 hours of sunlight, 250 watts X 6.8 hours results in 1.7 kilowatts of electricity. Producing 1.7 kilowatts X 30 days can produce 51 kilowatts of electricity in a month. This means from a house occupying 600 square feet:
This means that by installing solar energy in a house occupying 600 square feet, enough energy for that house can be produced. However, rural houses need to be made solar energy production friendly. On the other hand, micro-hydro projects can be operated by studying the possibility of reservoir-based electricity as there are evergreen sources of water. Electricity produced in this way can be sold to the national transmission line if there is excess. Since many households still use wood/firewood as the main fuel for cooking, electricity and solar energy can help replace wood/firewood. This also helps in environmental conservation. Therefore, it seems necessary to operate programs for maintenance and improvement of power transmission lines, installation of transformers, promotion of alternative and renewable energy in various wards of the municipality.
7.2.1 Households based on Cooking Fuel Use
Although Nepal is rich in water resources, due to underutilization, energy crisis is prevalent in urban and rural areas. Even today, in the hilly and Himalayan regions of Nepal, a large number of people use wood/firewood/coal as cooking fuel, while the use of cow dung cakes (Guitha) is widespread in the Terai region. Out of the total households in this Chaudandigadhi Municipality, 9,263 or 72.92 percent use wood/firewood/coal for cooking, and 3,195 or 25.15 percent use LP gas. Similarly, 84 households or 0.66 percent use electricity, 1 household or 0.01 percent uses kerosene, 148 households or 1.17 percent use biogas, 3 households or 0.02 percent use Guitha, and 9 households or 0.07 percent use other sources of fuel. The use of mostly wood/firewood by locals not only damages forests and the environment but also affects health due to smoke and takes more time to collect firewood, leading to loss of time. Therefore, it seems necessary to encourage the use of biogas as the best alternative energy option in rural areas and to lead the municipality residents towards alternatives to wood/firewood by focusing on income-generating programs. Detailed information is presented in the table.
Table No. 66: Households based on main fuel used for cooking
| Ward | Wood | LPG | Electricity | Guitha | Biogas | Kerosene | Others | Total |
|---|---|---|---|---|---|---|---|---|
| 1 | 709 | 49 | 0 | 0 | 14 | 1 | 0 | 773 |
| 2 | 890 | 229 | 8 | 0 | 16 | 0 | 1 | 1144 |
| 3 | 812 | 185 | 1 | 0 | 2 | 0 | 0 | 1000 |
| 4 | 1100 | 526 | 5 | 0 | 36 | 0 | 1 | 1668 |
| 5 | 1312 | 180 | 20 | 0 | 10 | 0 | 1 | 1523 |
| 6 | 599 | 728 | 2 | 0 | 20 | 0 | 3 | 1352 |
| 7 | 629 | 788 | 2 | 0 | 6 | 0 | 2 | 1427 |
| 8 | 780 | 74 | 3 | 0 | 4 | 0 | 0 | 861 |
| 9 | 1468 | 280 | 27 | 3 | 27 | 0 | 1 | 1806 |
| 10 | 964 | 156 | 16 | 0 | 13 | 0 | 0 | 1149 |
| Total | 9263 | 3195 | 84 | 3 | 148 | 1 | 9 | 12703 |
| Percent | 72.92 | 25.15 | 0.66 | 0.02 | 1.17 | 0.01 | 0.07 | 100 |
Source:National Census, 2078
Households details based on main fuel used for cooking
According to the concept of sustainable development, it is inevitable to change people's consumption patterns to maintain environmental balance. For example, Nepal has set a goal to reduce the population using wood, firewood, guitha, etc. as primary sources of fuel from 74.7 percent in the base year 2015 to 30 percent by 2030 (SDG-7) and to increase the use of LP gas for cooking from 18 percent (2015) to 33 percent. Embracing this national goal, it is necessary to orient the policies and programs of this municipality towards that.
7.2.2 Households based on Lighting Fuel Use
In all wards of this municipality, electricity maintenance, tariff collection, and implementation of electrification plans have been done by the Nepal Electricity Authority. According to the data of National Census, 2078, electricity seems to be the main source of fuel used for daily lighting.
Table No. 67: Details of Fuel Used for Daily Lighting
| Ward | Electricity | Solar | Kerosene | Biogas | Others | Total |
|---|---|---|---|---|---|---|
| 1 | 468 | 270 | 9 | 1 | 25 | 773 |
| 2 | 1089 | 27 | 9 | 1 | 18 | 1144 |
| 3 | 978 | 11 | 2 | 1 | 8 | 1000 |
| 4 | 1622 | 25 | 8 | 0 | 13 | 1668 |
| 5 | 1507 | 4 | 5 | 0 | 7 | 1523 |
| 6 | 1329 | 10 | 1 | 0 | 12 | 1352 |
| 7 | 1395 | 22 | 2 | 0 | 8 | 1427 |
| 8 | 754 | 68 | 16 | 0 | 23 | 861 |
| 9 | 1776 | 17 | 3 | 0 | 10 | 1806 |
| 10 | 1131 | 3 | 1 | 0 | 14 | 1149 |
| Total | 12049 | 457 | 56 | 3 | 138 | 12703 |
| Percent | 94.85 | 3.60 | 0.44 | 0.02 | 1.09 | 100 |
Source:National Census, 2078
Analyzing the source of fuel used by households in the municipality for daily lighting, out of a total of 12,703 households, 12,049 or 94.85 percent were found using electricity, 475 or 3.60 percent using solar, 56 or 0.44 percent using kerosene, 3 or 0.02 percent using biogas, and 138 or 1.09 percent using other sources of fuel. Detailed ward-wise information is presented in the table.
Details of Fuel Used for Daily Lighting
7.2.3 Families Using Alternative Energy (Micro-hydro, Solar, Bio-gas, Improved Cookstoves)
Helping to maintain environmental balance can be achieved if dependence on petroleum products is reduced and the use of renewable alternative energy is widespread. Since products like diesel, petrol, and kerosene are not produced in Nepal, we have to spend billions of rupees annually on importing petroleum products. For Nepal, a landlocked developing country, this is a major cause of foreign trade deficit. In the context where we are unable to effectively implement the policy of import substitution and export management in practice, we can become self-reliant in energy sources through the development of wind energy, solar energy, electrical energy, and biogas. Therefore, in the case of Nepal, local governments, provincial governments, and the federal government must formulate necessary policies and work for the development of renewable alternative energy.
7.3 Communication and Technology
The globalized society of the 21st century is in the age of information and communication. Although the urban areas of Nepal have almost embraced the revolution in the field of information and communication, television, newspapers, internet, telephone, mobile and courier services are yet to be expanded in rural areas. Fully developing these means of communication and technology and introducing rural people to the world of information and communication remains challenging. The Constitution of Nepal has defined the people's right to information as a fundamental right. Details regarding communication and technology available in the municipality are presented in the table.
Table No. 68: Details of Telephone Networks (Towers), Post Offices, Newspapers and Radio Stations within the Municipality
| SN | Communication Name | Address |
|---|---|---|
| 1 | Nepal Telecom | Chaudandigadhi Municipality Ward No. 7, 9, and 2 |
| 2 | Ncell | Chaudandigadhi Municipality Ward No. 6, 10, and 8 |
| 3 | Area Post Office | Beltar – 6, 10, 8 |
| 4 | Gadhi Khabar Patrika | Beltar |
| 5 | Radio Chaudandigadhi 94.4 MHz | Beltar – 7 |
Source:Office of Municipal Executive
7.3.1 Details regarding Access to Modern Amenities
Table No. 69: Details of Household Facilities and Amenities (Based on Multiple Answers)
| Description | Ward No. | Total | |||||||||
|---|---|---|---|---|---|---|---|---|---|---|---|
| 1 | 2 | 3 | 4 | 5 | 6 | 7 | 8 | 9 | 10 | ||
| No facility | 55 | 51 | 62 | 46 | 125 | 31 | 20 | 66 | 64 | 25 | 545 |
| At least one facility | 718 | 1,093 | 938 | 1,622 | 1,398 | 1,321 | 1,407 | 795 | 1,742 | 1,124 | 12,158 |
| Radio | 155 | 166 | 202 | 315 | 107 | 269 | 446 | 141 | 461 | 144 | 2,406 |
| Television | 87 | 454 | 482 | 852 | 752 | 835 | 835 | 199 | 902 | 632 | 6,030 |
| Landline Telephone | 4 | 0 | 10 | 18 | 5 | 67 | 86 | 6 | 6 | 9 | 211 |
| Mobile Phone (Simple) | 689 | 906 | 697 | 1,342 | 1,083 | 1,108 | 944 | 743 | 1,514 | 900 | 9,926 |
| Smart Mobile Phone | 354 | 739 | 558 | 1,140 | 895 | 1,125 | 1,226 | 475 | 1,207 | 704 | 8,423 |
| Computer/Laptop | 22 | 28 | 52 | 86 | 57 | 149 | 214 | 16 | 89 | 67 | 780 |
| Internet | 257 | 169 | 102 | 196 | 64 | 392 | 688 | 35 | 330 | 131 | 2,364 |
| Car/Jeep/Van | 6 | 13 | 2 | 11 | 9 | 36 | 62 | 6 | 10 | 19 | 174 |
| Motorcycle/Scooter | 217 | 164 | 166 | 310 | 219 | 375 | 363 | 124 | 451 | 201 | 2,590 |
| Cycle | 169 | 389 | 186 | 586 | 1,032 | 713 | 592 | 134 | 1,068 | 592 | 5,461 |
| Electric Fan | 79 | 685 | 611 | 1,289 | 1,058 | 1,128 | 1,152 | 230 | 1,282 | 864 | 8,378 |
| Refrigerator | 7 | 237 | 237 | 576 | 236 | 685 | 696 | 88 | 393 | 357 | 3,512 |
| Washing Machine | 0 | 2 | 1 | 2 | 2 | 17 | 13 | 1 | 2 | 0 | 40 |
| Air Conditioner | 0 | 0 | 0 | 1 | 1 | 7 | 8 | 0 | 5 | 0 | 22 |
Source:National Census, 2078
Based on resources and facilities, the number of households with bicycle availability seems to be high in the municipality. Of the total households in the municipality, 9,926 households have mobile phones (basic). Secondly, the number of families with smart mobiles is 8,423. The number of families with radio facilities is 2,406, while the number of families with television is 6,030. Overall, looking at the statistics, the major mobile service in the communication sector seems to be increasing, while internet service seems to be expanding. Since mobile users find it easier to perform many tasks like audio, video, information, songs, news exchange etc., the number of television and radio users seems to be decreasing compared to mobile. Due to being geographically remote, high hilly and cold terrain, the number of modern facilities in this municipality is low and the use of high-end amenities like car/jeep, air conditioner, heater or gas geyser seems to be low. However, even in rural areas, consumerist culture seems to be developing with the increasing number of users of modern luxury goods. Ward-wise detailed description is presented in the table.
Details of Household Facilities and Amenities
Details of Household Facilities and Amenities
7.4 Housing and Buildings
There are settlements with mixed population density in the municipality. Regarding settlement, it is customary to live scattered in areas suitable for market potential, water facilities, agricultural land, animal husbandry, and grain production. Therefore, depending on convenience, there are dense and sparse settlements in all wards. Most of the houses here are in raw and semi-permanent condition, while only a few houses are in permanent condition, meaning that the houses in this area are not free from risk from the perspective of earthquake and other disaster safety.
7.4.1 Households based on Roof Type
Table No. 70: Details of Households based on Roof Type
| Ward | Zinc/Tin | Cement | Thatch | Tile | Stone | Wood | Others | Total |
|---|---|---|---|---|---|---|---|---|
| 1 | 662 | 6 | 72 | 28 | 1 | 4 | 0 | 773 |
| 2 | 1,035 | 67 | 21 | 17 | 3 | 1 | 0 | 1,144 |
| 3 | 882 | 62 | 9 | 45 | 0 | 1 | 1 | 1,000 |
| 4 | 1,346 | 180 | 40 | 99 | 1 | 0 | 2 | 1,668 |
| 5 | 1,361 | 97 | 27 | 30 | 5 | 1 | 2 | 1,523 |
| 6 | 920 | 400 | 5 | 18 | 3 | 5 | 1 | 1,352 |
| 7 | 1,040 | 355 | 2 | 18 | 10 | 2 | 0 | 1,427 |
| 8 | 784 | 16 | 32 | 23 | 2 | 3 | 1 | 861 |
| 9 | 1,612 | 83 | 63 | 34 | 13 | 0 | 1 | 1,806 |
| 10 | 990 | 76 | 41 | 34 | 8 | 0 | 0 | 1,149 |
| Total | 10,632 | 1,342 | 312 | 346 | 46 | 17 | 8 | 12,703 |
| Percent | 84 | 11 | 2 | 3 | 0 | 0 | 0 | 100 |
Source:National Census, 2078
Details of Households based on Roof Type
Out of 12,703 households here, the number of families living in houses with zinc sheet/tin roofs is the highest, i.e., 10,632 or 83.70 percent. The number of families living in houses with cement concrete roofs is 1,342 or 10.56 percent, those with thatch/straw roofs is 312 or 2.46 percent, and those with stone/slate roofs is 46 or 0.36 percent. Similarly, the number of people living in houses with roofs of wood/plank, tile, etc. is found to be negligible.
7.4.2 Details of Government Buildings under Municipality
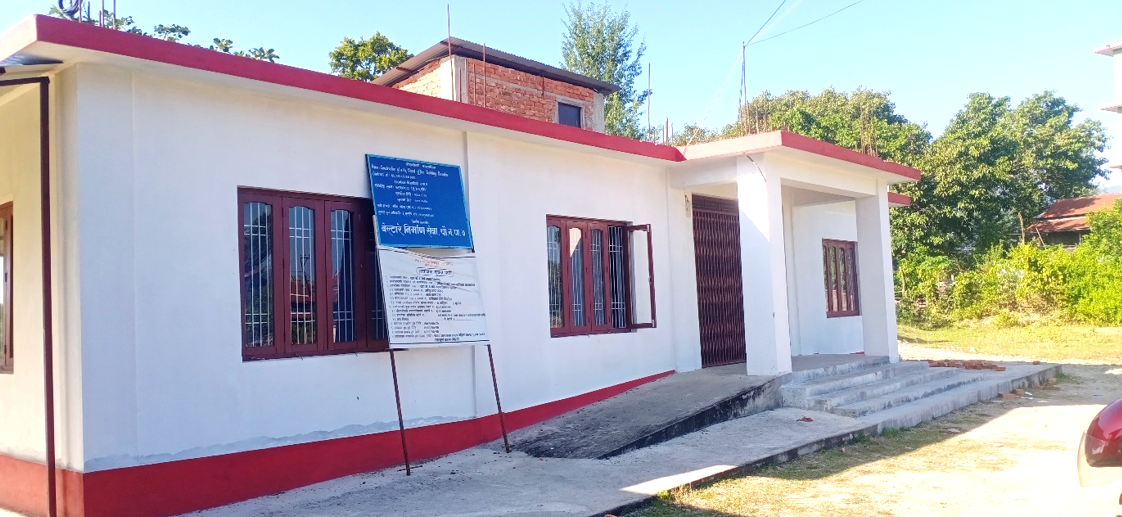
It is necessary for the local level to construct the municipal office building, ward office buildings and other essential government buildings on its own land or on land received from the Government of Nepal to make the performance smooth and effective and to give the people a sense of the government's presence. After the construction of such permanent structures, federalism will take institutional form.
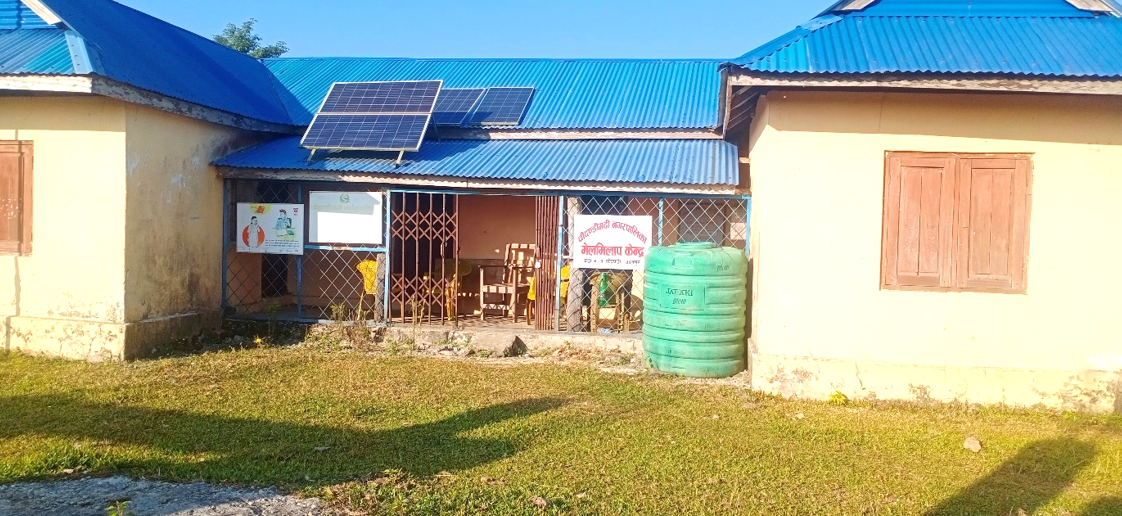
According to the recognition that the local government programs should be operated by constructing the necessary physical structures at the local level built under the federal governance system, it is necessary for the rural municipality/municipality to have its own community building and assembly hall. This municipality has its own concrete building and all the ward offices here have their own buildings. Similarly, there is a city hospital building in Ward No. 7 and health posts and basic health post buildings in all 10 wards. Details regarding community buildings and assembly halls in the municipality are presented in the table.
Table No. 71: Details of Community Buildings and Halls in Municipality
| SN | Building Name | Ward No. | Status | Remarks |
|---|---|---|---|---|
| 1 | Municipality Administrative Building | Ward No. 7 | Concrete Building | |
| 2 | Ward Offices | Ward No. (1-10) | ||
| 3 | City Hospital Building | Ward No. 7 | ||
| 4 | Health Post and Basic Health Post Buildings | Ward No. (1-10) |
Source:Office of Municipal Executive
7.4.3 Details of Slaughterhouse
If the local government works by prioritizing public health, healthy and positive thinking citizens can be produced and they can contribute to the development, construction and service sectors. Therefore, it seems desirable for the local government to formulate and implement a policy that certain criteria must be met before slaughtering meat animals and birds, ensuring the people's right to food security by constructing a clean slaughterhouse equipped with modern technology. There is no organized slaughterhouse in Chaudandigadhi Municipality. Animals are slaughtered in fresh houses and open places.
7.4.4 Details of Crematorium
In Nepal, the custom of performing death rites according to one's religious tradition has been going on since ancient times. Management of cremation sites and burial grounds according to the religion and culture of every municipality and every community is an important and sensitive issue and necessity. This issue, which also carries emotional meaning, should be addressed by any plan in time. Otherwise, unmanaged cremation adds a challenge to the environmental, social and cultural system of the municipality. Traditionally operating cremation sites and burial grounds should be made easy and organized in the future. Currently, the residents of Ward Nos. 9, 10 and 5 of this municipality are seen crematory on the banks of the Triyuga River, while the residents of other wards perform the last rites in open places and traditionally practiced river banks due to the lack of organized cremation sites and burial grounds. In the coming days, it is necessary for the municipality to start works such as building shelters for the management of cremation sites and burial grounds in necessary places, managing wood/firewood, managing worship shops so that necessary materials for death rites are available.